基于echarts的hexo博客热力图
最近觉得博客的 archive 页太空旷了,和首页雷同,且文章多了之后,archieve 页很长。archive 页平时也不做停留,基本没有意义。因此,我决定改造一下 archive,修复并添加一些东西。首先是历史文章要支持展开和收起,这样,archive 页面就不会过长了。然后,仿照 github contribution, 做一个 博客热力图,记录历史文章提交日历图。
展开/收起控件添加
在年份上添加一个 onclick 事件,来控制对应年份文章的 display 属性。难点是原模板中年份 div 和 post-item div 是平级的,即:
<div class="year"></div>
<div class="post-item"></div>
<div class="post-item"></div>
<div class="post-item"></div>
...
<div class="year"></div>
<div class="post-item"></div>
<div class="post-item"></div>
<div class="post-item"></div>
...
这样兄弟选择器是没法只选中对应的年份的所有文章的。解决方法是给文章的 div 添加对应的年份 class,如'y2023'.并且给 onclick 事件传入年份变量。
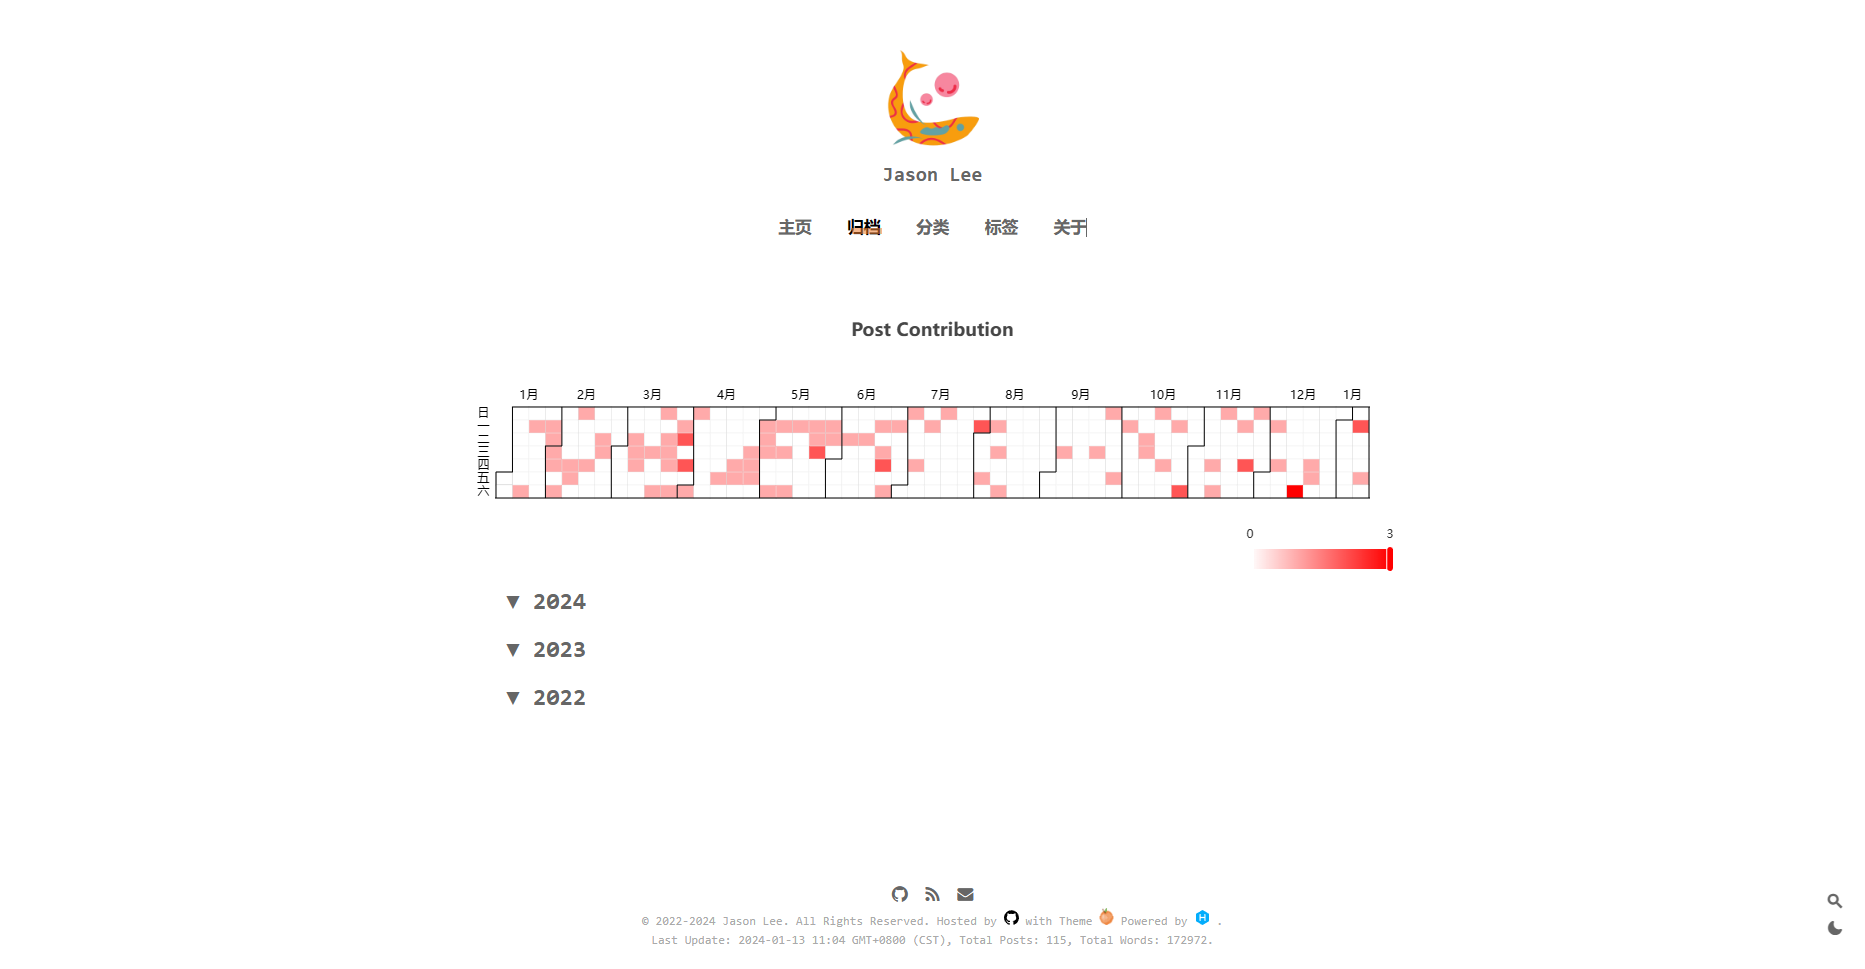
post contribution
echarts 是一个开源的图表库,支持创建丰富类型的图表,且配置性高。
echarts 使用手册 https://echarts.apache.org/handbook/zh/get-started/
开始并不顺利,安装就卡住了。按照'hexo echarts'去 google,得到的方案是装一个 npm 包,但是实际上无效,图表没有被解析。后来用了质朴的 cdn 导入方式才成功。安装成功后,跑了一个 demo 也成功了,可是实现我的定制化需求时又犯了难。我的需求是,显示过去一年内,每天的文章创建数。echarts 有很多配置项,不看文档是搞不清楚的。然而,配置项文档都是文字说明,没有对应的效果展示。还好,有 chatgpt。描述好需求,gpt 给出了非常接近的答案,再经过几轮问答补充细节后,我想要的效果就达成了。
接着是数据的问题。我一开始的想法是,先在 ejs 中遍历 site.posts,获得一个键为日期,值为当日发布文章数的对象。然后创建一个数据生成函数,遍历近一年的每一天,从之前的对象中取值。但是,当我实现到一半,发现一个问题:ejs 创建的对象,无法被 script 标签读到。又是 gpt 给出了解决方案:将对象绑定在全局 window 上。
完整代码:
  <div id="main" style="width:100%; height:300px; margin: 0 auto"></div>
  <%
  const postsCountByDate = {};
  site.posts.each((item, index) => {
    let postDate = new Date(item.date);
    // 获取年、月、日
    let formattedDate = postDate.getFullYear() + '-' + (postDate.getMonth() + 1) + '-' + postDate.getDate();
    postsCountByDate[formattedDate] = (postsCountByDate[formattedDate] || 0) + 1;
  });
  %>

  <script>
    // 将 postsCountByDate 绑定到全局对象 window 上
    window.postsCountByDate = <%- JSON.stringify(postsCountByDate) %>;
  </script>


  <script type="text/javascript">


      var chartDom = document.getElementById('main');
      var myChart = echarts.init(chartDom);
      var option;

      function generateRandomData(startDate, endDate) {
        let currentDate = new Date(startDate);
        const endDateObj = new Date(endDate);
        const data = [];


        while (currentDate <= endDateObj) {
          let formattedCur = currentDate.getFullYear() + '-' + (currentDate.getMonth() + 1) + '-' + currentDate.getDate();
          const val = postsCountByDate[formattedCur] || 0
          // const val = Math.floor(Math.random() * 100); // 生成 0 到 99 之间的随机数
          data.push([currentDate.toLocaleDateString(), val]);

          currentDate.setDate(currentDate.getDate() + 1);
        }

        return data;
      }

      const startDate = new Date(); //
      startDate.setFullYear(startDate.getFullYear() - 1); // 一年前的日期 e.g 2023.1.10
      const endDate = new Date(); // 当前日期 e.g 2024.1.10

      const simulatedData = generateRandomData(startDate, endDate);

      option = {
        title: {
          top: 30,
          left: 'center',
          text: 'Post Contribution'
        },
        tooltip: {},
        visualMap: {
          show: true,
          min: 0,
          max: 3, // 你的数据中的最大值
          calculable: true,
          orient: 'horizontal',
          left: 'right',
          bottom: 10,
          inRange: {
            color: ['#FFFFFF', '#FF0000'] // 白色到其他颜色的渐变色,可以根据需要调整颜色值
          },
          pieces: [
            { value: 0, color: '#FFFFFF' }, // 将值为0的数据映射到白色
            { min: 1 } // 其他数据按照设定的颜色渐变
          ]
        },

        calendar: {
          top: 120,
          left: 30,
          right: 30,
          cellSize: ['auto', 13],
          range: [startDate, endDate],
          itemStyle: {
            borderWidth: 0.5
          },
          yearLabel: { show: false }
        },
        series: {
          type: 'heatmap',
          coordinateSystem: 'calendar',
          data: simulatedData
        }
      };

      option && myChart.setOption(option);


  </script>
附上改造后的 archive 页:
更新
经过一段时间的使用,发现了以下问题:
- 右下角的范围筛选控件很丑,但是删不掉;
- 手机上显示效果很差。
在参考别人博客的类似效果后,我想实现:
- 鼠标悬停在单元��格上显示的是标题;
- 去掉筛选控件
这一次,又是 chatgpt 的答案就几近完美。看来它对 echarts 非常熟悉。
// 获取博客文章数据
const postsCountByDate = {};
site.posts.each((item, index) => {
  let postDate = new Date(item.date);
  // 获取年、月、日
  let formattedDate =
    postDate.getFullYear() +
    "-" +
    (postDate.getMonth() + 1) +
    "-" +
    postDate.getDate();
  let arrofTitle = postsCountByDate[formattedDate] || [];
  arrofTitle.push(item.title);
  postsCountByDate[formattedDate] = arrofTitle;
});

// heatmap options数据准备
var chartDom = document.getElementById("heatmap");
var myChart = echarts.init(chartDom);
var option;

var dates = Object.keys(postsCountByDate);
var colors = ["#FFFFFF", "#FFCCCC", "#FF9999", "#FF6666", "#FF3333", "#FF0000"];

// 提取数据中的标题
var titles = [];
Object.keys(postsCountByDate).forEach(function (key) {
  titles = titles.concat(postsCountByDate[key]);
});

// 计算最大值
var maxCount = Math.max.apply(
  null,
  Object.values(postsCountByDate).map((arr) => arr.length)
);

// 计算开头结尾时间,作为calendar的range
const startDate = new Date(); //
startDate.setFullYear(startDate.getFullYear() - 1); // 一年前的日期 e.g 2023.1.10
// const startDate = moment().subtract(6, 'months').toDate(); // 6个月前的日期 e.g 2023.7.10
const endDate = new Date(); // 当前日期 e.g 2024.1.10
let startDate_ = new Date(startDate);
let endDate_ = new Date(endDate);
formatted_startDate =
  startDate_.getFullYear() +
  "-" +
  (startDate_.getMonth() + 1) +
  "-" +
  startDate_.getDate();
formatted_endDate =
  endDate_.getFullYear() +
  "-" +
  (endDate_.getMonth() + 1) +
  "-" +
  endDate_.getDate();

option = {
  title: {
    top: 0,
    left: "center",
    // text: 'Post Contribution'
  },
  tooltip: {
    position: "top",
    formatter: function (params) {
      var date = params.data[0];
      var titles = postsCountByDate[date] || [];
      return titles.join("<br>");
    },
  },

  calendar: {
    top: "middle",
    left: "center",
    cellSize: ["auto", 13],
    range: [formatted_startDate, formatted_endDate],
    itemStyle: {
      borderWidth: 0.5,
    },
    yearLabel: { show: false },
    monthLabel: {
      nameMap: [
        "Jan",
        "",
        "Mar",
        "",
        "May",
        "",
        "Jul",
        "",
        "Sep",
        "",
        "Nov",
        "",
      ],
    },
    dayLabel: { show: true, firstDay: 1, nameMap: "en" },
  },
  series: {
    type: "heatmap",
    coordinateSystem: "calendar",
    data: dates.map(function (date) {
      return [date, postsCountByDate[date].length];
    }),
    label: {
      show: false,
      formatter: function (params) {
        return params.value[1];
      },
    },
    itemStyle: {
      normal: {
        color: function (params) {
          var count = params.value[1];
          var level = Math.ceil(count / (maxCount / colors.length));
          level = Math.min(level, colors.length - 1);
          return colors[level];
        },
      },
    },
  },
};

option && myChart.setOption(option);

// 响应式图表
window.addEventListener("resize", function () {
  myChart.resize();
});